
Internal Flow Assessment of an Industrial Globe Valve
Globe valves are widely used in piping and process systems where reliable isolation or regulation of fluid flow is required. Unlike a straight section of pipe, the internal geometry of a globe valve forces the fluid to change direction and pass through a restricted region between the valve plug and seat. This produces complex three-dimensional flow behaviour and can result in significant changes in velocity and static pressure.
Computational Fluid Dynamics (CFD) provides a practical method of examining these internal flow characteristics in detail. The analysis can reveal regions of flow acceleration, separation, recirculation and pressure loss that cannot be understood from the external valve geometry alone.
This study considers a representative flanged globe valve and demonstrates how CFD can be applied to investigate its internal hydraulic behaviour under a defined operating condition.
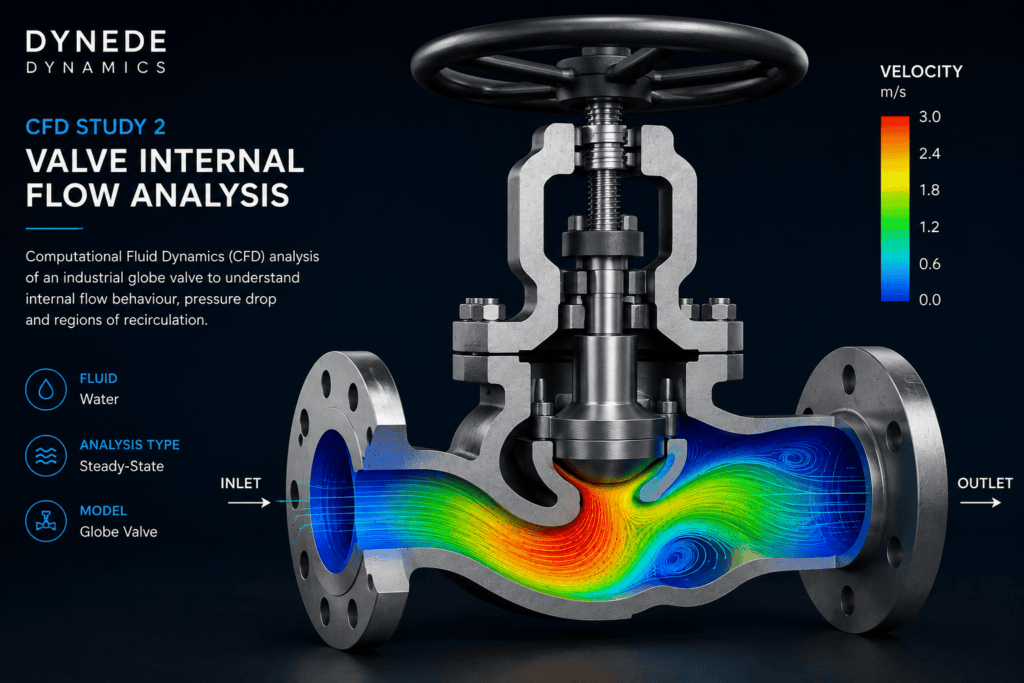
Cutaway globe valve showing internal CFD velocity field and flow streamlines
Project Overview
A three-dimensional CFD model is developed to represent flow through the internal passages of the globe valve. The fluid enters through the upstream flange, travels through the valve body, accelerates as it approaches the restricted seat region and subsequently expands into the downstream passage before leaving through the outlet.
The analysis is intended to demonstrate the relationship between valve geometry and the resulting flow field. Particular attention is given to the restricted flow area around the valve plug and seat, where relatively large velocity and pressure gradients may develop.
Rather than considering only a single pressure-drop value, the CFD solution allows the complete internal flow field to be visualised and interpreted.
Analysis Objectives
The principal objective of the study is to assess how the internal geometry of the valve influences fluid behaviour from inlet to outlet.
The CFD assessment considers:
- Development of the velocity field through the valve
- Flow acceleration through the restricted seat region
- Static-pressure variation between the upstream and downstream passages
- Flow separation following changes in passage geometry
- Formation of local recirculation regions
- Recovery and redistribution of the downstream flow
- Locations where geometric changes have a strong influence on hydraulic performance
These characteristics provide useful information when evaluating valve behaviour and identifying areas where further engineering investigation may be appropriate.
CFD Model Development
For internal-flow CFD analysis, the computational domain represents the fluid volume inside the valve, rather than the complete solid valve assembly.
The internal wetted passages are therefore extracted from the representative valve geometry to create a continuous fluid domain extending from the inlet to the outlet. The valve plug and seat are included because their relative position defines the principal flow restriction and strongly influences the resulting velocity and pressure fields.
Geometric details that do not materially influence the internal flow may be simplified where appropriate. This allows computational effort to be concentrated on the regions that control the hydraulic behaviour of the valve.
The model retains the principal features required to represent the flow path, including the inlet and outlet passages, body cavity, seat region and valve plug.
Boundary Conditions
Appropriate boundary conditions are applied to establish a representative internal-flow problem.
The upstream face defines the inlet to the computational domain, while the downstream face provides the corresponding outlet condition. Internal surfaces of the valve body, seat and plug are represented as solid wall boundaries.
The resulting flow direction follows the characteristic globe-valve path: fluid approaches the central restriction, changes direction through the seat region and then enters the downstream passage.
The precise operating conditions used in a commercial analysis would normally be selected from the actual system requirements, including fluid properties, flow rate, upstream conditions and downstream pressure.
For this illustrative study, the emphasis is on demonstrating the CFD methodology and interpretation of the resulting flow structures rather than claiming performance data for a specific manufactured valve.
Mesh Strategy
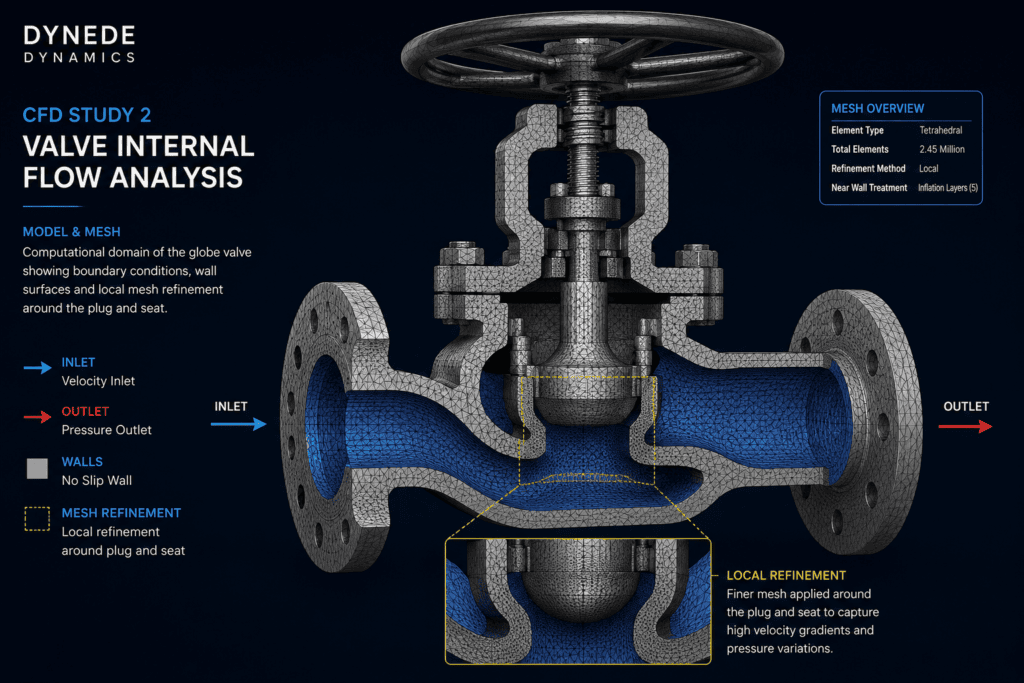
The computational domain is discretised using a three-dimensional CFD mesh capable of representing both the overall internal passage and the more demanding flow regions around the valve restriction.
A relatively finer mesh is required around the plug and seat, where the available flow area changes rapidly and comparatively steep velocity and pressure gradients can occur.
Additional refinement may also be appropriate around regions of strong curvature, flow separation and downstream recirculation. Near-wall resolution is considered so that the interaction between the fluid and the internal valve surfaces can be represented appropriately for the selected modelling approach.
Mesh quality and local refinement are important because insufficient resolution around the restriction can obscure important flow features and affect the predicted pressure loss.
Velocity Distribution & Flow Behaviour
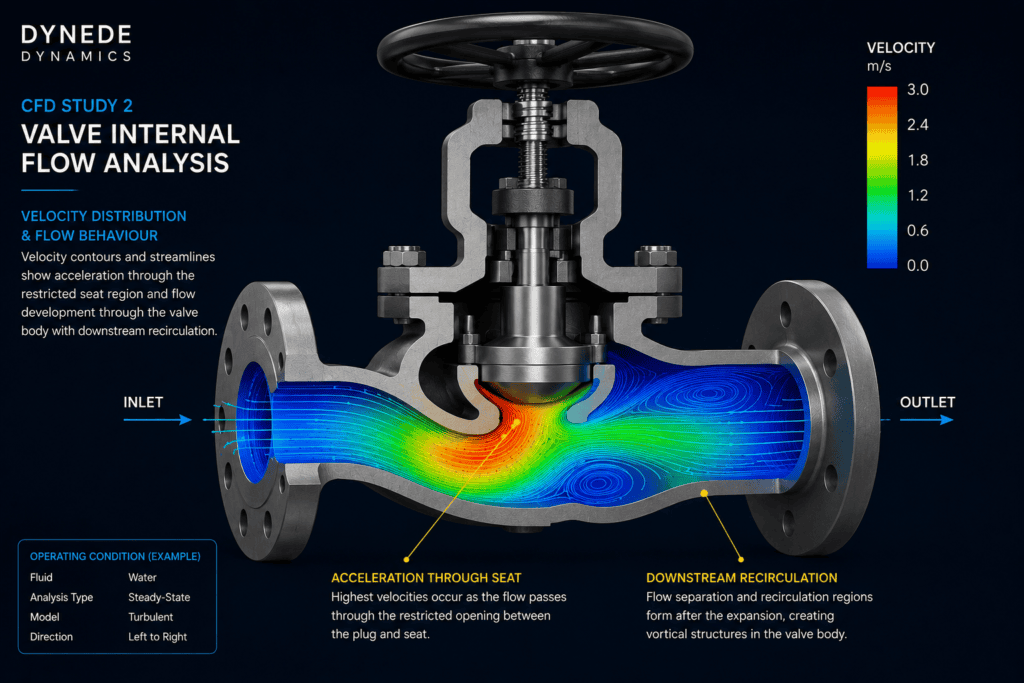
The velocity field provides one of the clearest representations of how the valve geometry affects the fluid.
As the flow approaches the valve seat, the available flow area becomes restricted. The fluid therefore accelerates through the reduced passage between the plug and seat before entering the larger downstream region.
After passing through this restriction, the rapidly moving fluid interacts with the surrounding valve cavity. Expansion of the flow passage and changes in direction can produce non-uniform velocity distributions, separated flow and recirculation.
The resulting downstream flow may therefore remain highly three-dimensional for some distance after the principal restriction.
These effects are important because local velocity behaviour can influence pressure loss, erosion potential, vibration, noise and overall valve performance.
Static Pressure Distribution
The static-pressure field provides complementary information to the velocity results.
As fluid accelerates through the restricted valve passage, a reduction in static pressure is generally expected. Additional irreversible pressure losses arise from viscous effects, changes in flow direction, separation and mixing within the downstream region.
Examining the pressure distribution throughout the valve helps identify where the principal hydraulic losses develop rather than treating the entire valve as a single pressure-drop element.
The combined interpretation of pressure and velocity results is therefore more useful than considering either field independently.
For an actual engineering application, the calculated pressure difference between appropriately selected upstream and downstream locations could be used as part of a quantitative assessment of valve performance.
Recirculation & Secondary Flow
The internal geometry of a globe valve creates conditions where the flow does not necessarily remain attached to the surrounding surfaces.
Downstream of the seat restriction, the high-velocity flow can enter a substantially larger region of the valve body. The combination of rapid expansion, curvature and interaction with the surrounding fluid may generate separated and recirculating regions.
Streamlines are particularly useful for visualising this behaviour because they illustrate the direction of the three-dimensional flow rather than only its local magnitude.
Identifying these regions can help engineers understand where inefficient flow structures develop and where modifications to the internal geometry might improve hydraulic behaviour.
Engineering Interpretation
The CFD results demonstrate that the hydraulic behaviour of a valve is governed by considerably more than its nominal inlet and outlet diameter.
The geometry surrounding the plug and seat controls the effective restriction, while the shape of the downstream cavity influences how the accelerated flow expands and recovers. Consequently, relatively small changes to internal geometry can alter local velocities, pressure losses and recirculation patterns.
For engineering design work, CFD results of this type can support investigations into:
- Valve pressure loss
- Internal flow uniformity
- Seat and passage geometry
- Local high-velocity regions
- Potential erosion-sensitive areas
- Flow separation and recirculation
- Geometry optimisation
- Comparison of alternative valve configurations
The required level of modelling detail should be selected according to the purpose of the analysis and the decisions that will be made from the results.
Results Overview
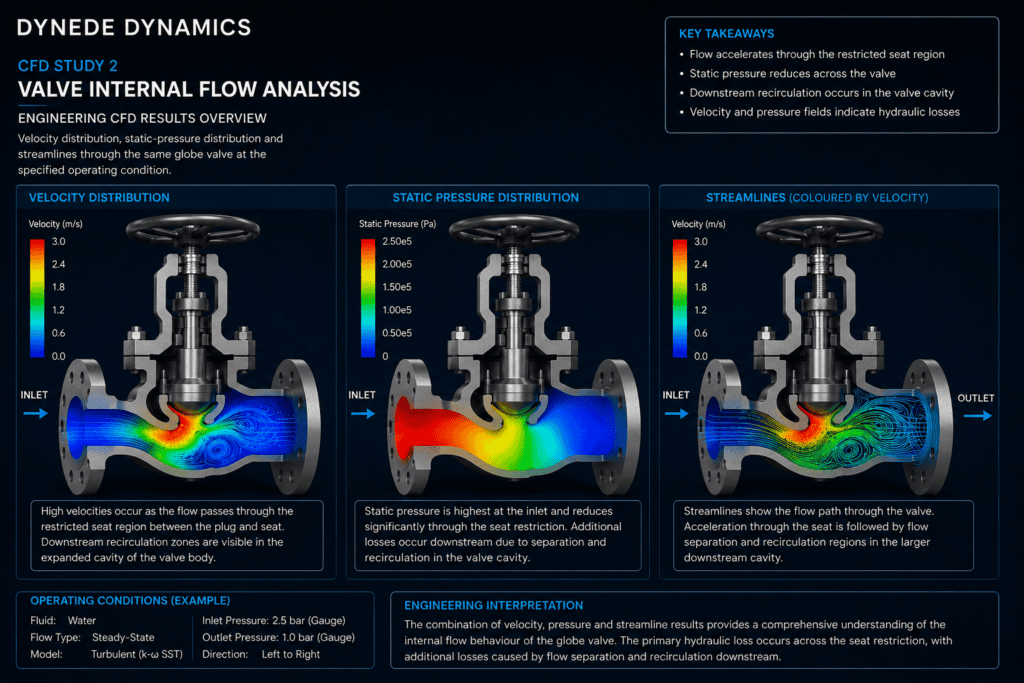
The velocity and pressure fields provide complementary views of the valve’s internal hydraulic performance.
The velocity solution identifies acceleration through the restriction and the subsequent redistribution of flow, while the pressure solution indicates how hydraulic energy is lost as the fluid passes through the valve. Streamline visualisation further reveals separated and recirculating flow structures that may not be obvious from contour plots alone.
Together, these results provide a coherent picture of the relationship between internal geometry, flow restriction and hydraulic performance.
Engineering Considerations
CFD predictions depend on the assumptions used to construct the numerical model. Appropriate consideration should therefore be given to mesh resolution, fluid properties, turbulence modelling, boundary conditions and convergence behaviour.
Where the analysis is being used for design verification or performance prediction, additional studies may be required to assess sensitivity to mesh density and operating conditions.
Depending on the application, further investigation could include multiple valve-opening positions, different flow rates, alternative plug or seat geometries, transient operation, cavitation assessment or comparison with experimental or manufacturer performance data.
Outcome & Next Steps
This study demonstrates how CFD can be used to investigate the complex internal flow behaviour of a globe valve and identify the mechanisms responsible for velocity redistribution, pressure loss and recirculation.
The analysis provides a foundation for more detailed engineering work in which the valve geometry or operating conditions can be varied systematically and their influence on hydraulic performance compared.
Where required, the CFD model can be extended to support design optimisation, pressure-loss assessment, evaluation of alternative internal geometries and investigation of specific operating conditions.
Discuss Your Engineering Requirements
Dynede Dynamics provides CFD support for internal-flow problems involving valves, piping systems, manifolds, ducts and other fluid-handling equipment, from computational-domain development and boundary-condition definition through to results interpretation and engineering reporting.
Discuss your CFD or fluid-flow requirements with Dynede Dynamics to determine an appropriate analysis approach for your application.